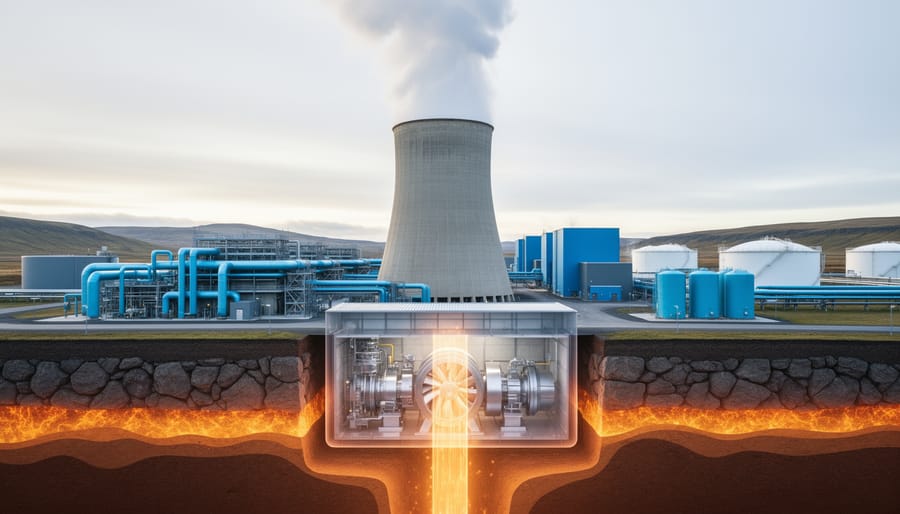
A geothermal power plant diagram illustrates how underground heat transforms into electrical energy through three distinct system configurations: dry steam, flash steam, and binary cycle plants. Each configuration extracts thermal energy from the geothermal power source differently, depending on reservoir temperature and fluid characteristics, but all follow the same fundamental principle of capturing Earth’s internal heat to drive turbines.
Understanding these diagrams requires familiarity with key components like production wells that extract hot fluid from depths often exceeding 10,000 feet, separator vessels that manage steam and liquid phases, turbine-generator assemblies that convert kinetic energy to electricity, and injection wells that return cooled water to maintain reservoir pressure. The visual language of geothermal schematics employs standardized symbols representing valves, heat exchangers, condensers, and cooling towers, creating a universal reference system for engineers and students alike.
This breakdown decodes each diagram element across all three plant types, explains energy flow pathways from subsurface extraction to grid transmission, and provides practical guidance for interpreting technical schematics whether you’re a renewable energy professional, engineering student, or simply building your understanding of clean power generation technologies.
Core Components of a Geothermal Power Plant Diagram
A geothermal power plant diagram typically illustrates eight fundamental components that work together to convert underground thermal energy into electrical power. Each element serves a specific role in the continuous cycle of heat extraction and energy conversion.
Production wells appear as vertical shafts extending deep into the earth’s crust, often reaching 1.5 to 3 kilometers below the surface. These wells tap directly into geothermal reservoirs, porous rock formations saturated with hot water or steam heated by magma chambers below. In diagrams, production wells are usually depicted on the left side, marked with upward arrows indicating the flow of geothermal fluid toward surface facilities. The walls of these wells are typically lined with steel casing and cement to maintain structural integrity under extreme temperatures that can exceed 300°C.
Heat exchangers occupy a central position in many plant diagrams, particularly for binary cycle systems. These devices transfer thermal energy from the geothermal fluid to a secondary working fluid without the two liquids mixing. Diagrams show them as rectangular or cylindrical vessels with distinct inlet and outlet pipes. The efficiency of heat exchange directly determines overall plant performance, making this component critical for lower-temperature resources.
The turbine converts thermal energy into mechanical rotation. Diagrams represent turbines as circular or blade-shaped symbols connected to the steam or vapor input line. High-pressure fluid strikes the turbine blades, causing rapid rotation that drives the connected generator shaft. Modern geothermal turbines are designed to handle the corrosive minerals and gases present in geothermal steam.
Adjacent to the turbine sits the generatorshown as a cylindrical component with electrical output lines extending toward the grid connection. The rotating turbine shaft spins electromagnetic coils inside the generator, producing alternating current through electromagnetic induction.
The condenser appears downstream from the turbine, depicted as a large vessel where spent steam returns to liquid form. This condensation creates the vacuum that draws more steam through the turbine, maintaining continuous operation. Diagrams show cooling water pipes running through the condenser to facilitate heat removal.
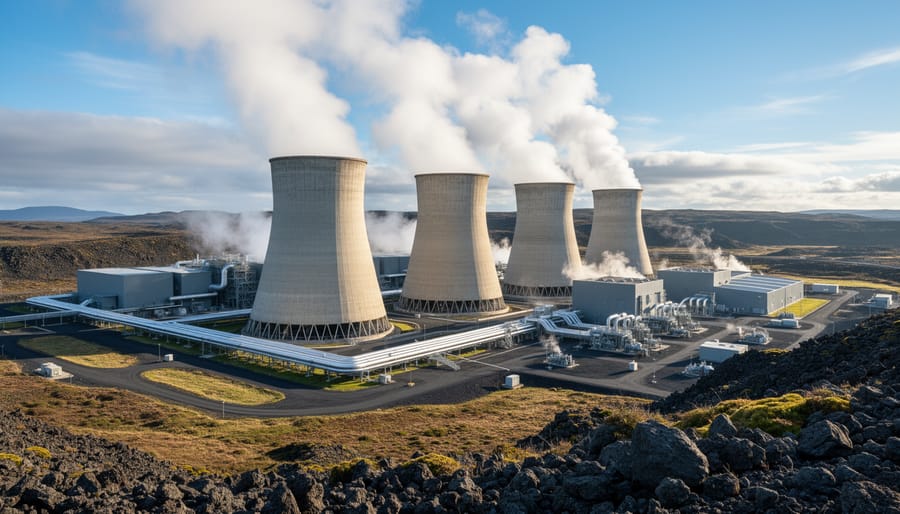
Cooling towers are illustrated as large structures receiving warm water from the condenser. These distinctive hyperbolic or rectangular towers use evaporative cooling to dissipate waste heat to the atmosphere, allowing water to be recirculated rather than consumed.
Finally, injection wells complete the cycle, shown as downward-sloping paths returning cooled geothermal fluid back to the reservoir. This reinjection maintains reservoir pressure, sustains long-term productivity, and prevents surface water contamination, a feature that distinguishes sustainable geothermal operations in 2026.
Three Main Geothermal Plant Configurations
Dry Steam Plants
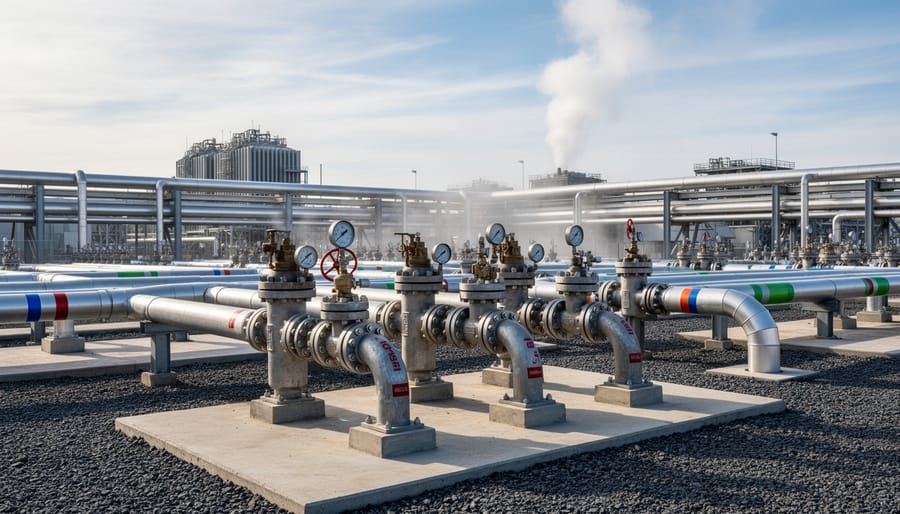
Dry steam plants represent the most straightforward geothermal configuration, dating back to the first commercial facility at Larderello, Italy in 1904. Their diagrams are notably minimalist compared to other plant types because they eliminate intermediate conversion steps.
In a dry steam diagram, you’ll see production wells drawing steam directly from underground reservoirs at temperatures exceeding 235°C (455°F). The steam travels through a single pipeline to the turbine-generator unit without requiring flash tanks or heat exchangers. After passing through the turbine, the spent steam enters a condenser where cooling water transforms it back to liquid. The condensed water typically routes to an injection well for reservoir replenishment.
These diagrams show fewer components because dry steam resources are geologically rare, requiring both high temperatures and low water content. The Geysers in California, the world’s largest geothermal field, exemplifies this plant type. Modern dry steam diagrams incorporate gas extraction systems to remove non-condensable gases before the steam reaches the turbine, protecting equipment and maintaining efficiency.
Flash Steam Plants
Flash steam plants dominate the commercial geothermal landscape because they efficiently exploit moderate- to high-temperature water reservoirs (above 182°C) that exist in many active geothermal regions. In standard diagrams, these systems are recognizable by their distinctive pressure separation vessel, the flash tank or separator, positioned between the production well and turbine. Hot pressurized water from the reservoir enters this vessel where a controlled pressure drop triggers rapid vaporization: as pressure decreases, a portion of the water “flashes” into steam while the remaining liquid settles to the bottom.
Diagrams typically show this separation process with branching flow paths, steam rising to drive the turbine while separated brine flows toward reinjection wells or, in multi-stage configurations, to a secondary flash tank for additional steam extraction. Flash steam plants are most common globally because they extract maximum energy from resources that are too cool for direct dry steam operation yet hot enough to generate substantial quantities of superheated vapor. Double-flash variants appear in diagrams with two separators operating at different pressures, improving overall efficiency by recovering energy from fluid that would otherwise be discarded after the first flash stage.
Binary Cycle Plants
Binary cycle plants represent the most versatile configuration for geothermal power generation, distinguished in diagrams by their dual-fluid design. Unlike dry steam and flash steam systems that work directly with geothermal fluids, binary plants use lower-boiling fluid such as isobutane or isopentane as a secondary working medium. The diagram shows geothermal water flowing through one side of a heat exchanger, transferring thermal energy to the secondary fluid without the two ever mixing. This closed-loop approach means the geothermal fluid never leaves its sealed circuit, it flows from production wells through the heat exchanger and returns via injection wells, while the secondary fluid circulates separately through its own turbine-generator-condenser cycle.
Diagrams of binary plants highlight this separation with distinct color coding or line styles, typically solid lines for the geothermal loop and dashed or differently colored lines for the working fluid circuit. The heat exchanger sits at the center of the schematic, often depicted as a series of parallel tubes or a shell-and-tube configuration. Because the secondary fluid operates at lower pressure and temperature than in conventional steam plants, binary cycle diagrams show smaller turbines and simpler condensing systems, often air-cooled rather than water-cooled, which reduces water consumption significantly.
The Energy Flow: Tracing Heat to Electricity
Geothermal diagrams illustrate a remarkable energy transformation that begins kilometers underground and ends at the electrical grid. Following the flow arrows reveals how raw thermal energy converts through multiple stages into usable electricity, a process fundamentally different from combustion-based generation yet sharing mechanical principles with how hydro works and wind efficiency in rotating turbines to generate power.
The conversion sequence visible in plant diagrams follows a precise thermodynamic pathway:
- Thermal extraction from the geothermal reservoir, where production wells tap into naturally heated rock formations containing water or steam at temperatures ranging from 150°C to 370°C depending on geological conditions.
- Fluid transport through production piping to the surface, with diagram arrows showing upward flow driven by pressure differential and sometimes assisted by downhole pumps in lower-pressure reservoirs.
- Steam generation or separation, where flash vessels reduce pressure to convert hot water into steam (flash plants), direct steam routing (dry steam plants), or heat exchange to vaporize a secondary working fluid (binary cycle plants).
- Mechanical rotation as high-pressure steam expands through turbine blades, converting thermal and pressure energy into rotational kinetic energy at speeds typically between 1,800 and 3,600 rpm.
- Electromagnetic induction in the generator, where the turbine shaft rotates copper windings within a magnetic field, producing alternating current through Faraday’s law of electromagnetic induction.
- Electrical transformation and transmission, with step-up transformers increasing voltage for efficient grid delivery as shown by diagram lines extending to transmission infrastructure.
Diagrams emphasize the closed-loop nature through return arrows depicting spent fluid flowing to condensers, where cooling towers or air-cooled systems restore it to liquid state. The cooled fluid then travels through injection wells back to the reservoir, maintaining pressure and sustainability. This reinjection loop, critical for long-term operation, appears as curved arrows completing the circuit.
Temperature and pressure indicators along flow paths reveal the thermodynamic gradient driving the process. Steam entering turbines might show 180°C at 8 bar, while condenser exit points indicate 40°C near atmospheric pressure. These deltas represent the exploitable energy window. Bold flow arrows typically indicate primary energy pathways, while thinner lines mark auxiliary systems like cooling water circulation or non-condensable gas extraction. Understanding this visual hierarchy helps decode which processes are essential versus supportive in the overall energy conversion chain.
Reading Environmental and Safety Features in Plant Diagrams
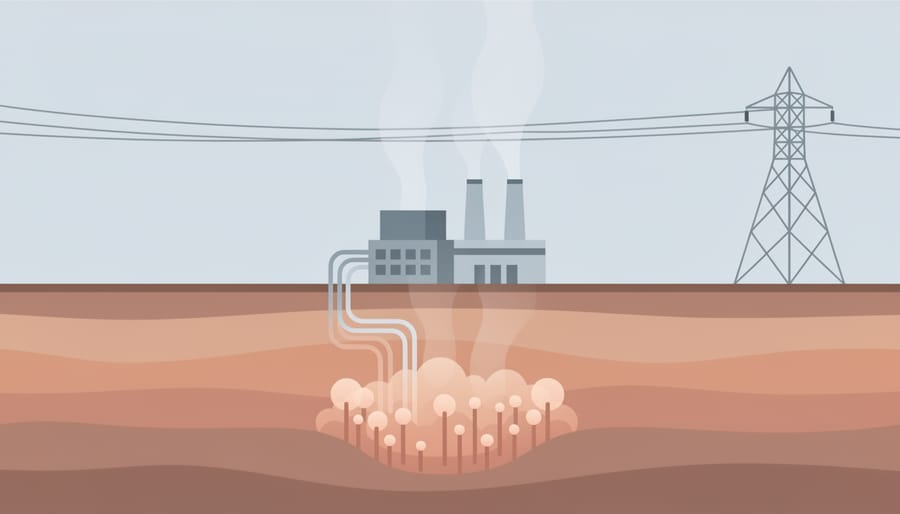
Modern geothermal power plant diagrams emphasize environmental stewardship and operational safety through specific design elements that have become standard in 2026 installations. These features distinguish contemporary plants from earlier designs, reflecting both regulatory requirements and industry best practices.
Reinjection systems appear prominently in diagrams as return pipelines connecting condensers back to the geothermal reservoir. This closed-loop approach serves dual purposes: it maintains reservoir pressure for sustained production and prevents surface disposal of geothermal fluids. Look for injection well symbols positioned strategically around the production zone, often at cooler periphery locations to avoid thermal short-circuiting. The reinjection cycle typically recovers 80-95% of extracted fluid, making these systems nearly water-neutral.
Non-condensable gas handling equipment addresses H₂S, CO₂, and other gases that separate during steam production. Diagrams show these systems as separate processing loops branching from the main condenser. Hydrogen sulfide abatement units, represented by scrubber or oxidation tower symbols, convert toxic H₂S to elemental sulfur or harmless compounds before atmospheric release. Carbon dioxide separation systems enable GHG reductions through capture and potential sequestration, though geothermal CO₂ emissions remain minimal compared to fossil fuel plants.
Seismic monitoring networks appear as sensor arrays distributed across the field in comprehensive diagrams. These monitor micro-seismicity induced by fluid extraction and injection, providing real-time data to adjust operations and mitigate seismic risk. Some advanced diagrams incorporate automated shutdown triggers linked to seismic thresholds.
Cooling tower designs reflect water conservation priorities. Air-cooled condensers, shown as large finned structures in diagrams, eliminate water consumption entirely in arid regions. Hybrid systems balance water use with efficiency, automatically switching between wet and dry cooling based on ambient conditions and resource availability. These environmental features cost more upfront but reduce long-term operational risks and regulatory exposure while demonstrating responsible resource management.
Common Diagram Symbols and Conventions
Geothermal power plant diagrams follow internationally recognized engineering symbology established by standards organizations like ISO and ASME. Mastering these conventions transforms complex schematics into readable roadmaps of system operation.
Pipe and Flow Indicators
Single lines represent process piping, with arrows indicating flow direction. Dashed lines typically denote instrument signal connections rather than physical piping. Double parallel lines often signify insulated pipes carrying high-temperature fluids. Line thickness variations may indicate relative pipe diameter or primary versus secondary circuits.
Valve Representations
Gate valves appear as two triangles meeting at their points, while globe valves show a circular body with an internal barrier. Check valves display an arrow or angled flap indicating one-way flow. Control valves include an actuator symbol, often a spring-and-diaphragm icon, showing automated operation based on temperature, pressure, or flow conditions.
Instrumentation Symbols
Temperature measurement points use a “T” within a circle, while pressure indicators display “P” or “PI” (pressure indicator). Flow meters appear as circles with “F” or “FT” (flow transmitter). Level sensors in flash tanks or condensers use “L” or “LT” designations.
Equipment Conventions
Turbines appear as stylized blade wheels within housings. Generators connect directly via mechanical coupling lines. Heat exchangers show two fluid paths crossing without mixing, tube-and-shell configurations display concentric circles. Pumps use a circle with an impeller symbol and directional arrow, indicating where mechanical energy moves fluids against pressure gradients.
These standardized symbols enable engineers worldwide to interpret geothermal plant designs regardless of manufacturer or geographic origin.
Frequently Asked Questions About Geothermal Power Plant Diagrams
Understanding the technical language of geothermal power plant diagrams raises several recurring questions among students, engineers, and energy planners. These diagrams are standardized representations, but variations in design and terminology can create confusion for those new to the field or comparing different plant configurations.
What’s the difference between open-loop and closed-loop systems in diagrams?
Open-loop systems extract geothermal fluid from the reservoir, use it directly for power generation, then either release it or reinject it back underground, this appears as a linear flow path in diagrams. Closed-loop systems, common in binary plants, keep the geothermal fluid separate from the working fluid that drives the turbine, shown as two distinct circulation circuits connected only at the heat exchanger.
Why do some diagrams show multiple wells?
Commercial geothermal plants typically require multiple production wells to extract sufficient fluid volume and multiple injection wells to return spent fluid to the reservoir, maintaining pressure equilibrium and system sustainability. The number of wells shown indicates field infrastructure rather than a single plant unit, with larger facilities operating dozens of wells across the geothermal field.
How efficient is the energy conversion shown in these diagrams?
Geothermal power plants typically convert 10-25% of the thermal energy extracted into electricity, with binary cycle plants at the lower end and dry steam plants reaching higher efficiency. The lower efficiency compared to fossil fuel plants reflects the relatively lower temperatures of geothermal resources and thermodynamic limitations, though this is offset by the renewable, continuous nature of the heat source.
How do enhanced geothermal systems differ in diagram representation?
Enhanced geothermal systems diagrams include engineered fracture zones in the rock formation where water is pumped under high pressure to create or expand permeability, unlike conventional systems that tap naturally permeable reservoirs. These diagrams often show injection and production wells at greater depths and may indicate hydraulic stimulation equipment and monitoring systems that track induced fracture networks.
These clarifications help readers move beyond surface-level diagram interpretation to understand the engineering decisions and physical constraints that shape geothermal power infrastructure. Recognizing these details enables more critical evaluation of project proposals, technology comparisons, and feasibility studies presented in technical documentation.
Understanding geothermal power plant diagrams unlocks more than technical literacy, it reveals how one of the planet’s most reliable renewable energy sources converts subsurface heat into round-the-clock electricity. Unlike intermittent renewables, geothermal systems provide baseload power with capacity factors exceeding 90%, making these diagrams essential reference tools for engineers, policymakers, and energy professionals navigating the transition to clean electricity.
The visual representations we’ve explored demonstrate proven technology. Dry steam, flash steam, and binary cycle configurations have operated commercially for decades, with installations worldwide generating over 16,000 MW. Their diagrams show mature, field-tested systems rather than experimental concepts.
As enhanced geothermal systems and hybrid plant designs emerge, these diagrams will evolve to depict new components, deeper drilling technology, advanced heat exchangers, and integrated thermal storage. Yet the fundamental principles remain: extracting heat, transferring energy, spinning turbines, generating electricity.
For anyone working in renewable energy infrastructure, climate policy, or sustainable development, the ability to read these diagrams translates abstract geothermal potential into concrete understanding of how we’ll power our grid without carbon emissions. The technology is ready. The diagrams show exactly how it works.